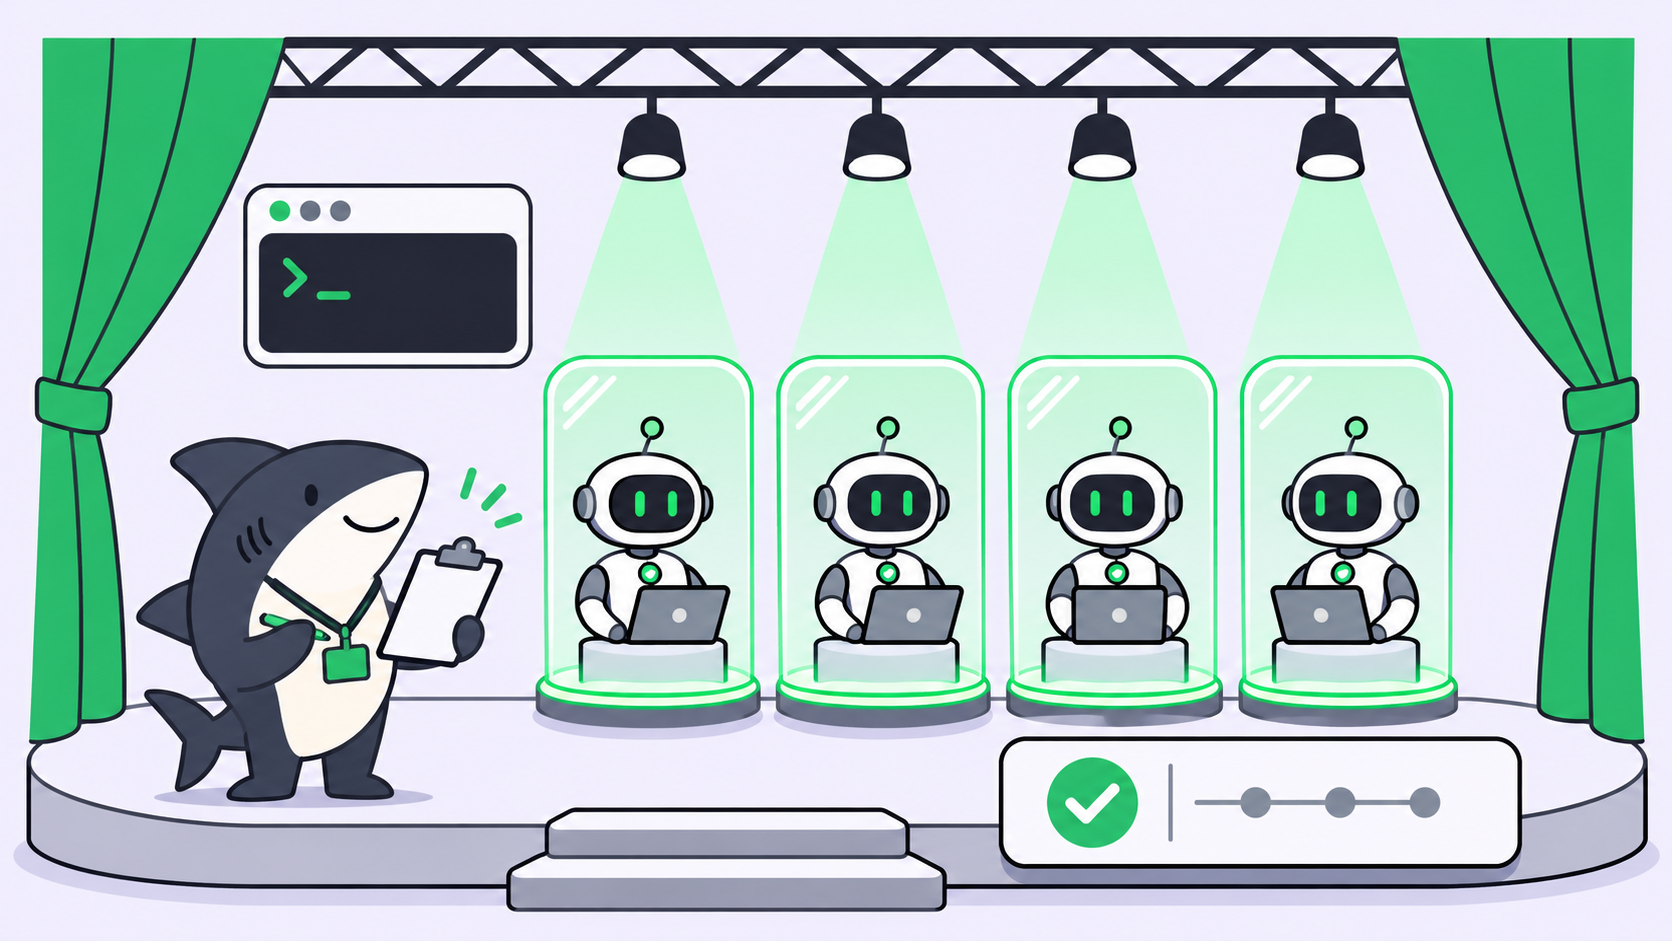
Windows 11 coding agent telemetry is now a documented finding, not a rumor. On November 16, 2026, security researcher Xusheng Li published a teardown showing that a Windows 11 diagnostic component checks for codex.exe, claude.exe, copilot.exe, cursor.exe and a list of developer tools, records which ones ran, and queues that record for upload to Microsoft when optional diagnostic data is on.
If you run Claude Code, Codex or Cursor on company laptops, you probably want three answers: what leaves the device, whether it is on for you, and how to switch it off across every PC. This guide covers all three, plus how teams that run agents through Sharkly can use their Computer list as the checklist.
TL;DR
Windows 11 ships a component, MissionControlAggregator.dll, that flags when known coding agents and developer tools run. It stores a bitmap, not prompts or code, and sends it as optional diagnostic data. A clean US install had optional data on by default. Turn it off under Settings, Privacy & security, Diagnostics & feedback, or set the Allow diagnostic data policy for a fleet.
What Windows 11 coding agent telemetry collects
According to Li’s write-up, the component matches executable names against fixed slots. The feature flag guarding the agent checks is named CLICodingAgentUsage.
| Slot group | Names checked |
|---|---|
| CLI agents (4) | copilot.exe, claude.exe, codex.exe, agy.exe (extensionless names on the WSL route) |
| Desktop agents (5) | github.exe, claude.exe, codex.exe, cursor.exe, antigravity.exe |
| Developer tools (12 categories) | node.exe, python.exe, dotnet.exe, gcc.exe, clang.exe, gdb.exe, javac.exe, devenv.exe, code.exe and others |
A match sets a bit. Once a day or so, the component turns those bits into a report called Segments.SubCohorts. In Li’s test, a Codex CLI run showed up as CliAgentSubCohorts: 4, which is the binary flag for slot 2.
Here is what the report does not contain, based on the teardown:
- No prompt text
- No source code or file paths
- No per-agent runtime or time in focus (the source events carry those, but the component drops them)
- No separate bit per compiler: GCC and Clang share one category
So the record says “this device ran Codex and a compiler this window,” not “this developer spent four hours in Claude Code on the billing repo.” That is narrower than some headlines suggest. It still tells Microsoft which agent vendors your engineers use, and for some teams that is the sensitive part.
Does it only catch WSL agents?
No. Li found three input routes. WSL exec events feed the CLI matchers, and so do regular Windows process summaries from the KernelProcess provider. Desktop apps reach the desktop matchers through Win32kTraceLogging interaction summaries. A plain Windows codex.exe in PowerShell counts.
Does it check the real binary?
Mostly by name. Li copied cmd.exe, renamed it codex.exe, ran it, and the Codex bit was set. Some developer-tool slots also check the publisher (Node.js expects the Node.js Foundation), but the agent slots matched on the name alone in his tests.
How the data leaves the device
The pipeline runs inside the Connected User Experiences and Telemetry service, DiagTrack. It starts a child process, AggregatorHost.exe, which loads the DLL. The DLL does not scan processes itself. It subscribes to Event Tracing for Windows (ETW) events that Windows already produces, then writes its own report back to ETW.
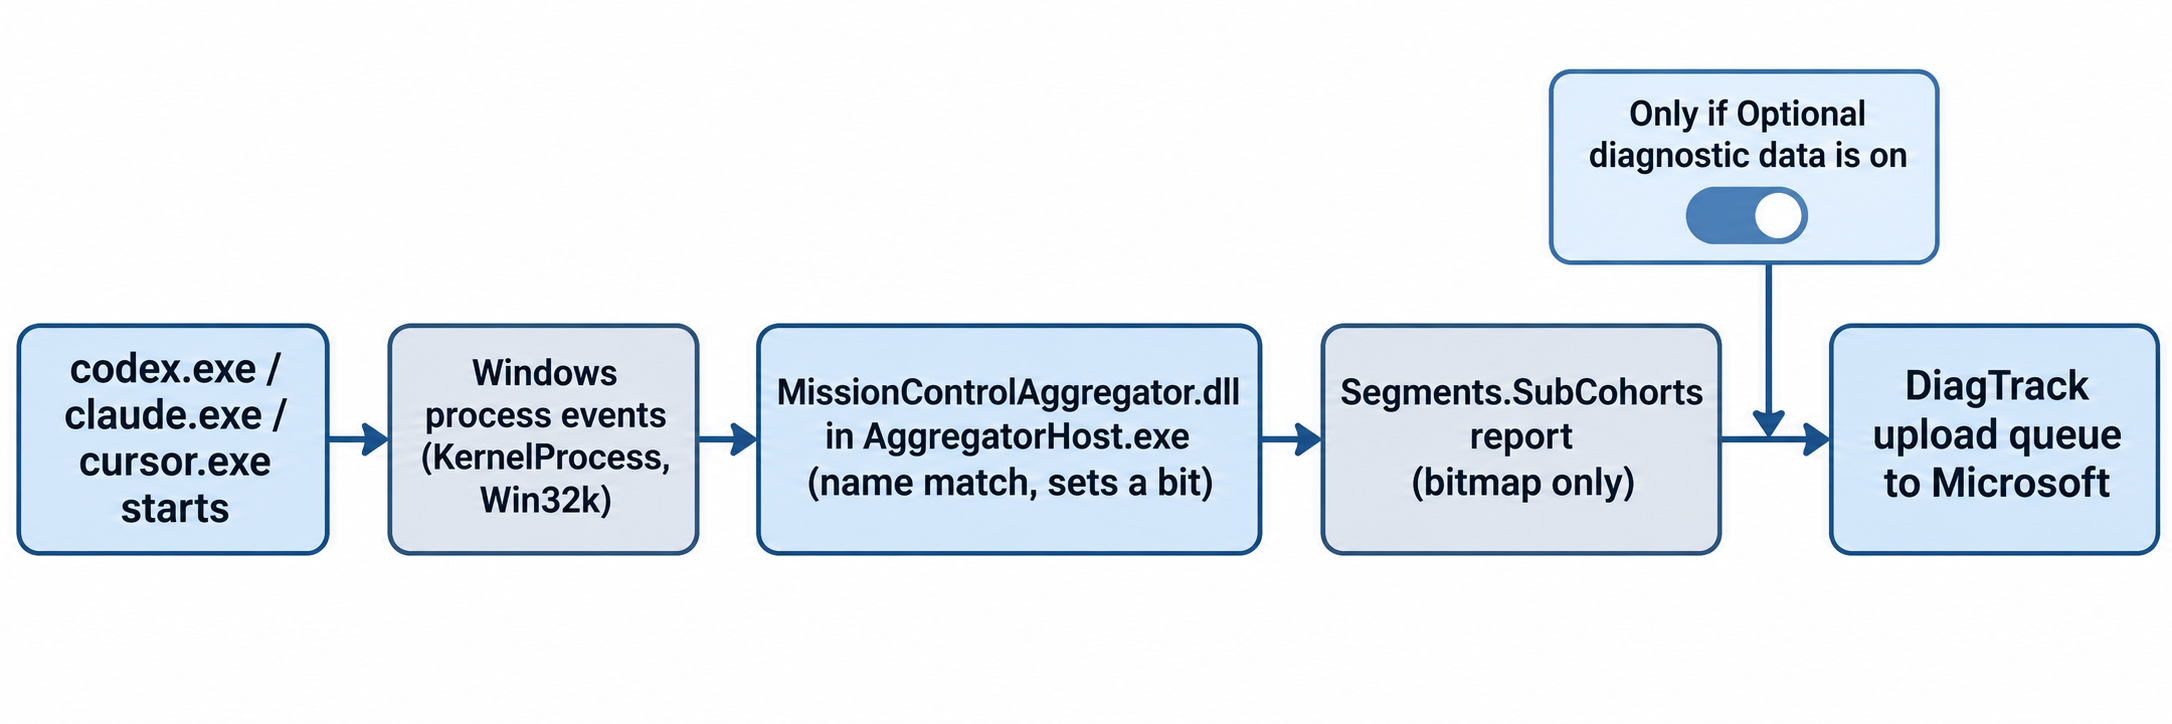
The upload gate is the important part. In DiagTrack’s local event store, the agent report carries "isRequired": false. That marks it as optional diagnostic data. With optional data allowed, Windows queues it for upload; with only required data, it stays off the queue.
The default is what makes this a story. Li ran a clean Windows 11 Home ARM64 install from the latest official ISO with the region set to the United States. The Diagnostic data toggle was already on and labeled Include Optional, and the AllowTelemetry value read 3. If nobody on your team declined it during setup, assume it is on. Other regions and editions may differ.
How to check your own PC
You can confirm each piece in about two minutes. Open PowerShell as an administrator.
- Check that DiagTrack is running:
Get-Service DiagTrack - Check that the aggregator module is loaded:
tasklist /m MissionControlAggregator.dll - Read the diagnostic level Windows is using (look for
AllowTelemetry;3means optional data is on,1means required only):
Get-ItemProperty -Path 'HKLM:\SOFTWARE\Microsoft\Windows\CurrentVersion\Policies\DataCollection' -ErrorAction SilentlyContinue |
  Select-Object AllowTelemetry
Get-ItemProperty -Path 'HKLM:\SOFTWARE\Policies\Microsoft\Windows\DataCollection' -ErrorAction SilentlyContinue |
  Select-Object AllowTelemetry
- Look at the saved state folder Li identified:
C:\ProgramData\Microsoft\Diagnosis\AggregatorStorage\ - To see what Windows sends, install Microsoft’s Diagnostic Data Viewer and search for
MissionControlAggregator.
If step 2 returns no task, the component is not loaded on that build. Li saw it on build 26200.9974, enabled as a service experiment he never turned on himself.
How to turn off Windows 11 coding agent telemetry
Because the agent report is optional data, dropping to required diagnostic data keeps it off the upload queue. Microsoft documents four levels in its diagnostic data configuration guide:
| Level | Old name | Sends the agent report? | Editions |
|---|---|---|---|
| Diagnostic data off | Security | No | Enterprise, Education, Server only |
| Required diagnostic data | Basic | No | All |
| Enhanced | Enhanced | n/a | Windows 10 1809 and earlier only |
| Optional diagnostic data | Full | Yes | All |
On a single PC
Go to Settings, then Privacy & security, then Diagnostics & feedback, and turn off Send optional diagnostic data. Microsoft’s privacy support page walks through the same screen. While you are there, delete the stored diagnostic data for the device.
Across a team with Group Policy
In the Group Policy Management Console, open Computer Configuration, Administrative Templates, Windows Components, Data Collection and Preview Builds. Set Allow diagnostic data to Send required diagnostic data. On Enterprise or Education you can pick Diagnostic data off instead. Microsoft recommends required data as the floor if you rely on Windows Update.
Across a team with MDM or a script
Intune and other MDM tools use the System/AllowTelemetry setting from the Policy CSP. On unmanaged PCs, the same policy as a registry value looks like this:
New-Item -Path 'HKLM:\SOFTWARE\Policies\Microsoft\Windows\DataCollection' -Force | Out-Null
Set-ItemProperty -Path 'HKLM:\SOFTWARE\Policies\Microsoft\Windows\DataCollection' `
  -Name AllowTelemetry -Type DWord -Value 1
A policy value also stops users from flipping the toggle back on in Settings.
Know which PCs run coding agents
The hard part for a team is rarely the setting. It is knowing which laptops and build boxes run agents at all. A lead who ships agent work across ten PCs needs a list, not a guess.
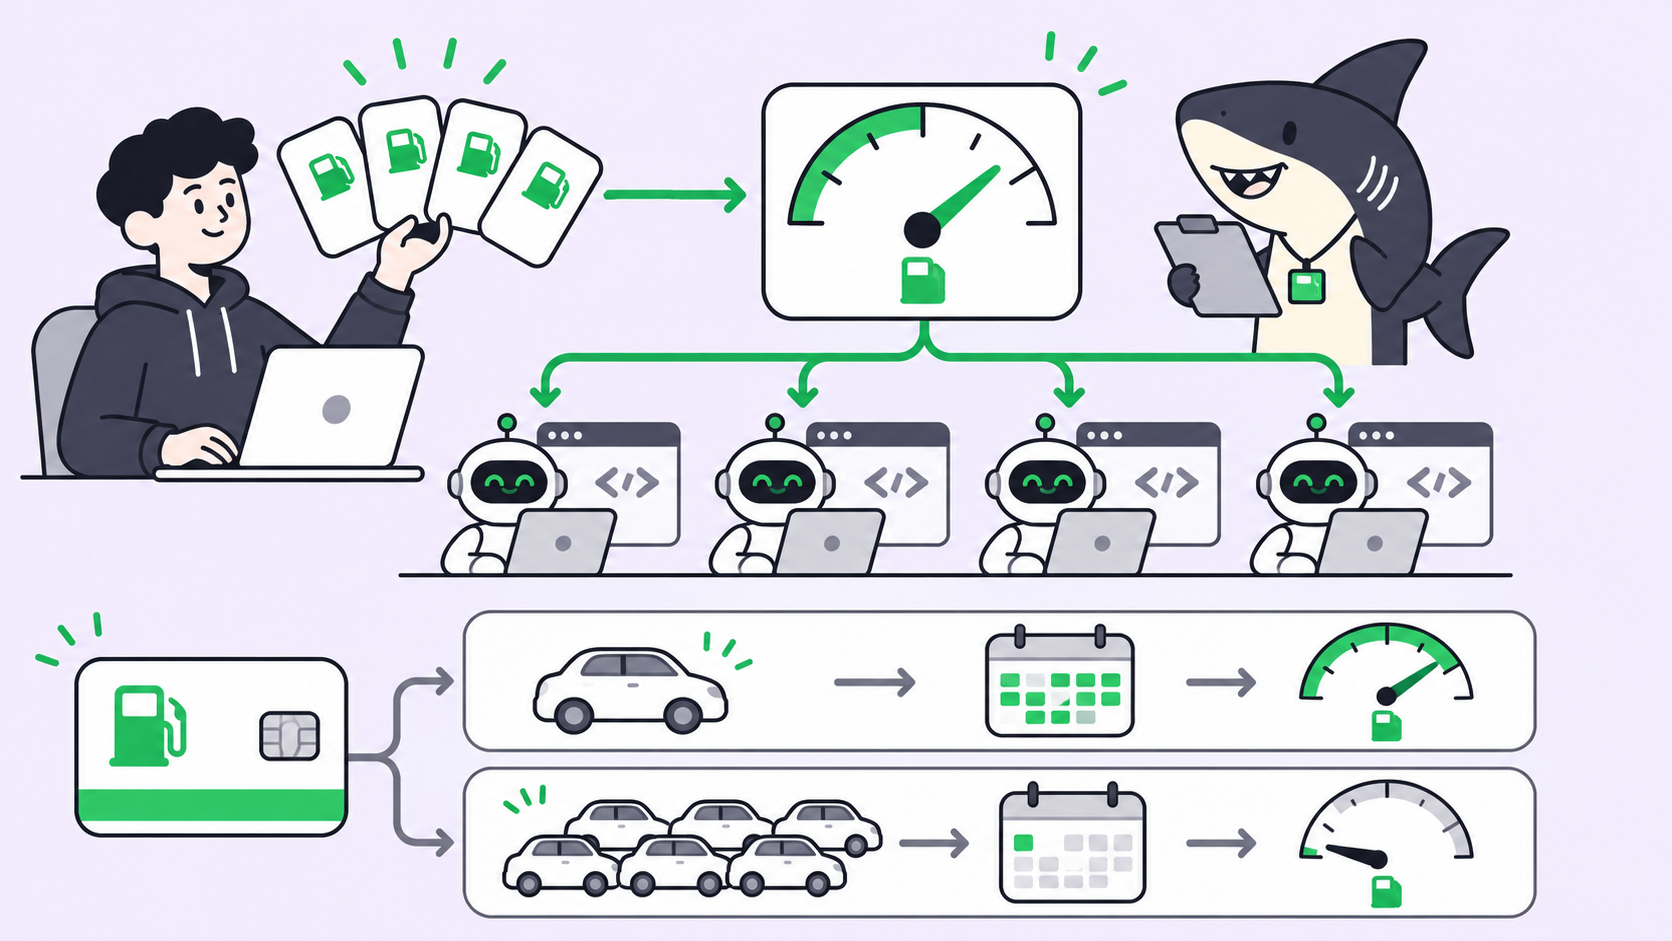
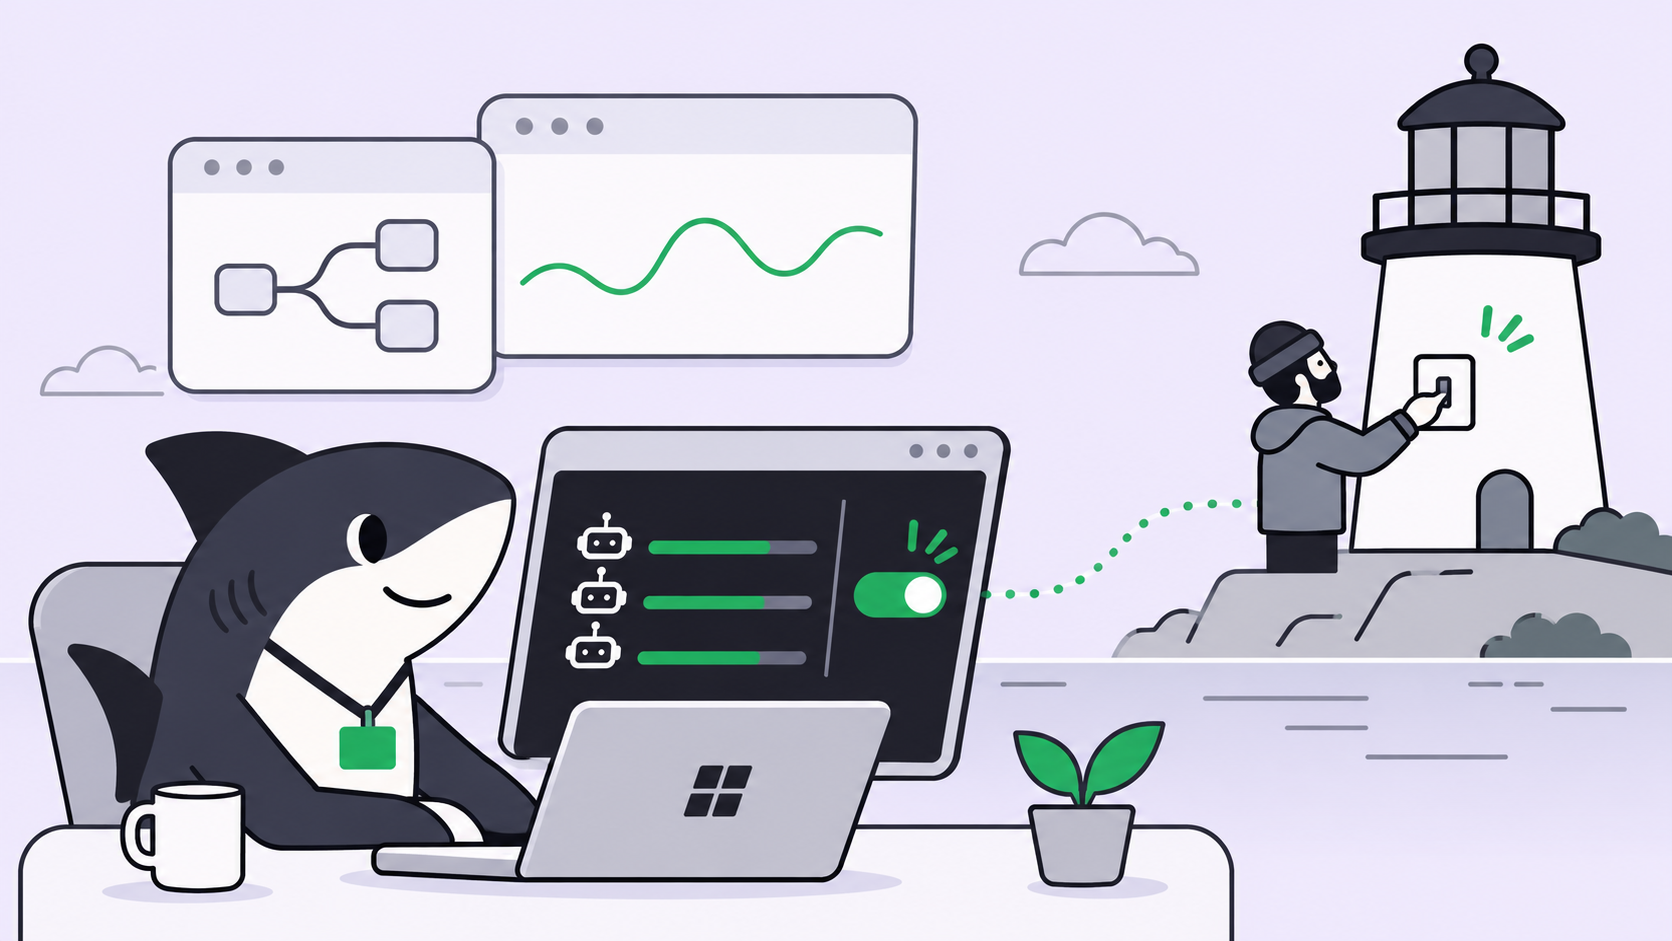
If your agents run through Sharkly, that list already exists. Each Computer is a host you registered with sharkly computer register, and its detail page shows every Runtime, meaning each coding agent tool the local service detected on it.
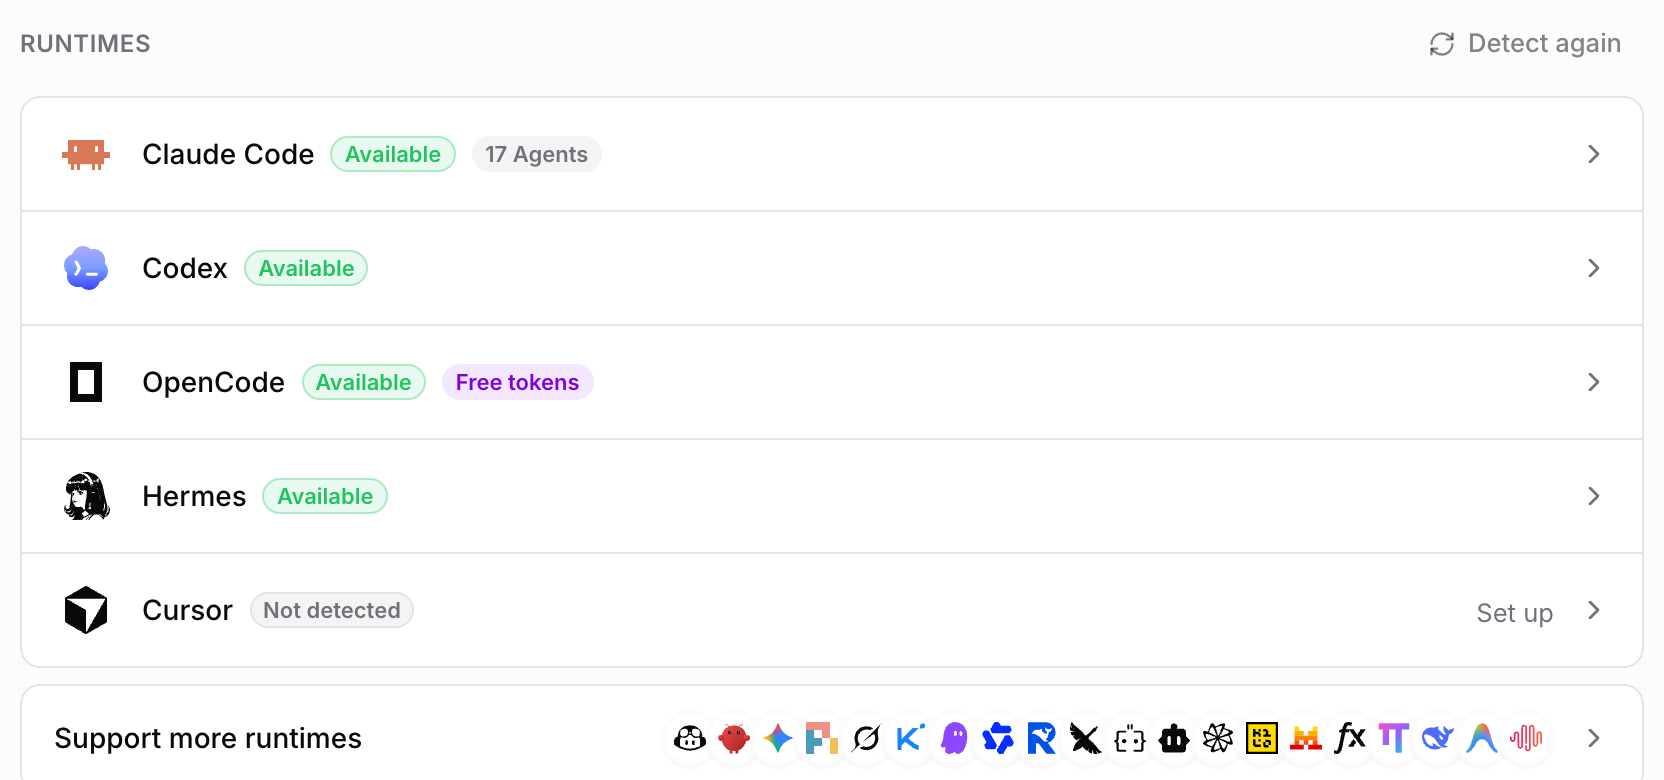
Use it as your audit list: every Windows Computer showing Claude Code, Codex or Cursor as a Runtime gets the policy above. Our guide to Computers in Sharkly covers registration, and Codex Cloud vs your own Computers covers when work should stay on hardware you control.
Be precise about what Sharkly sees too. The local service sends heartbeats, run progress and results back to Sharkly, because that is how the board tracks work. Model usage stays on the Claude Code, Codex or API plan attached to each Runtime. Every tool on a dev box has some data path; the job is to know each one and decide on purpose. The same thinking applies to coding agent permissions.
What this finding does not prove
Read the teardown for what it is: one researcher, one build, careful method. Three limits matter.
- Version drift. Microsoft can change the slots, the gate or the default in any update. Re-run the checks after feature updates.
- Intent. The report’s name,
Segments.SubCohorts, hints at usage segmentation, but nothing in the teardown states Microsoft’s purpose. - Other telemetry. This covers one Windows report. Your agents, IDEs and package managers each have their own telemetry settings, and turning this one off changes none of them.
Conclusion
Windows 11 coding agent telemetry is narrow in content and broad in reach: a bitmap of which agents ran, sent by default on a US Home install. The fix is one setting per PC or one policy per fleet. Start by listing every Windows host that runs an agent. If your agents already run as Sharkly Computers, open the Computers page, find the Windows hosts, and apply required diagnostic data to each one today. You can connect your first Computer in a few minutes if you have not yet.
FAQ
Does Windows 11 send my prompts or code to Microsoft?
Not in this report. Li’s teardown found only a bitmap of which agent and tool categories ran during the reporting window. Other Windows diagnostics are separate and governed by the same level settings.
Which coding agents does Windows 11 detect?
The CLI slots cover Copilot, Claude, Codex and agy.exe. The desktop slots cover GitHub, Claude, Codex, Cursor and Antigravity, matched by executable name.
Is optional diagnostic data on by default?
On the clean US Windows 11 Home install Li tested, yes. Check AllowTelemetry on your own PCs instead of assuming.
Can I turn diagnostic data off completely on Windows 11 Pro?
No. The Diagnostic data off level works only on Enterprise, Education and Server. On Pro and Home, required diagnostic data is the lowest level, and it keeps the agent report off the upload queue.
Does renaming an agent executable avoid detection?
In Li’s tests the agent slots matched by name, so a renamed binary would likely slip past. Changing the diagnostic level is the supported fix; renaming tools breaks updates and scripts.
Does WSL hide agent usage?
No. WSL exec events feed the same CLI matchers, using extensionless names such as codex.